2.3. Create gridded sections
Once the section longitude and latitude endpoints have been defined, and the param.py file has been
properly set, the next step is to process the model grid. This is achieved in three steps:
Coordinates and scale factors are extracted over the entire domain and stored into a
pypago.coords.Coordsobject.Coordinates and scale factors are extracted over the region of interest, and the variables are eventually zonally flipped. The subdomain variables are stored in a
pypago.grid.Gridobject.Finally, the section endpoints are converted into the
pypago.grid.Gridobject, and sections out of the domain are discarded.
These steps can be performed either by using Python scripts or by using the
pypago.guis.gui_grid_model Python program.
Warning
These steps require a NetCDF file containing the variables defined in the dictvname variable (either default values or values defined in the param.py file).
Both methods are described bellow.
2.3.1. Using Python scripts
2.3.1.1. Extracting coord objects
Extraction of coord objects is achieved by using the pypago.coords.create_coord() function as follows:
"""
Extraction of model coordinates,
and saving into a Pygo file.
"""

import pypago.coords

modelname = 'NEMO'
filename = 'data/mesh_mask.nc'

# loading coords
coord = pypago.coords.create_coord(modelname, filename)

pypago.pyio.save(coord, 'data/nemo_coords.pygo')
In [1]: import os

In [2]: cwd = os.getcwd()

In [3]: print(cwd)
/home/barrier/Codes/pago/pypago/doc_pypago

In [4]: fpath = "examples/define_coords.py"

In [5]: with open(fpath) as f:
   ...:     code = compile(f.read(), fpath, 'exec')
   ...:     exec(code)
   ...:
Reading longitude: variable glamt
Reading latitude: variable gphit
No bathymetry is read
Reading T-grid mask: variable tmask
Reading T-grid zonal width: variable e1t
Reading T-grid meridional width: variable e2t
Reading V-grid eastern meridional width: variable e2u
Reading U-grid northern meridional width: variable e1v
Reading T-grid height: variable e3t
Reading 1D deptha array: variable gdept_0
Reading mbathy: variable mbathy
Reconstruction of bathy from mbathy and depth
Dzt is 3D. Model grid is in partial step
Reading U-grid eastern height: variable e3u
Reading V-grid northern height: variable e3v
Reading U-grid mask: variable umask
Reading V-grid mask: variable vmask
Reconstruction of U-grid western height from U-grid eastern height
In [6]: print(coord)
Coords object:
  -filename: data/mesh_mask.nc
  -modelname: NEMO
  -bathy: (149, 182)
  -dxn: (149, 182)
  -dxt: (149, 182)
  -dye: (149, 182)
  -dyt: (149, 182)
  -dyw: None
  -dze: (31, 149, 182)
  -dzn: (31, 149, 182)
  -dzt: (31, 149, 182)
  -dzw: (31, 149, 182)
  -latt: (149, 182)
  -lont: (149, 182)
  -mask: (149, 182)
Note that the user may also use the executable program pypago.bin.make_coords as follows:
make_coords.py NEMO data/mesh_mask.nc coords.pygo
The arguments are the model name, the path of the meshfile and the path of the output file.
Note
The param.py file still needs to be in the working directory
2.3.1.2. Extracting grid objects
The grid objects are obtained by using the pypago.grid.create_grid() function.
Its arguments are the i (imax and imin) and j (jmin and jmax) indexes of the subdomain to extract. When one argument is None, then the higher (or lower) possible index is taken. Note that if imax<imin, zonal periodicity is assumed.
Warning
For regional studies, imax should always be greater than imin
An example of a subdomain extraction with zonal periodicity is shown below.
"""
Extraction of a sub-domain grid. Three examples
are provided: indian grid, North-Atlantic Grid
or Indian ocean (with a longitude flip).
"""

import pylab as plt
import pypago.grid

# indian example
jmin = 10
jmax = 100
imin = 140
imax = 40

coord = pypago.pyio.load('data/nemo_coords.pygo')

# if you do not have a coord object saved in a file, use:
# coord = pypago.coords.create_coord("NEMO", 'data/mesh_mask.nc')

# creation grid
grid = pypago.grid.create_grid(coord,
                               jmin=jmin, jmax=jmax,
                               imin=imin, imax=imax)

# saving of the grid
pypago.pyio.save(grid, 'data/indian_grid.pygo')

# drawing the domain on top of the
# coord mask
plt.figure()
coord.plot_mask()
grid.plot_dom()
plt.title('global domain')
plt.savefig('figs/indian_domain')

# drawing the domain mask
plt.figure()
grid.plot_mask()
plt.title('indian grid')
plt.savefig('figs/indian_grid')
In [7]: import os

In [8]: cwd = os.getcwd()

In [9]: print(cwd)
/home/barrier/Codes/pago/pypago/doc_pypago

In [10]: fpath = "examples/define_grid_indian.py"

In [11]: with open(fpath) as f:
   ....:     code = compile(f.read(), fpath, 'exec')
   ....:     exec(code)
   ....:
Extraction of lont on the domain
Extraction of latt on the domain
Extraction of bathy on the domain
Extraction of mask on the domain
Extraction of dxt on the domain
Extraction of dyt on the domain
Extraction of dxn on the domain
Reconstruction of the dyw variable from dye
In [12]: print(grid)
Model grid for the NEMO model:
    - mesh file: data/mesh_mask.nc
    - jmin: 10
    - jmax: 100
    - imin: 140
    - imax: 40
    - nlat: 91
    - nlon: 83
    - nz: 31
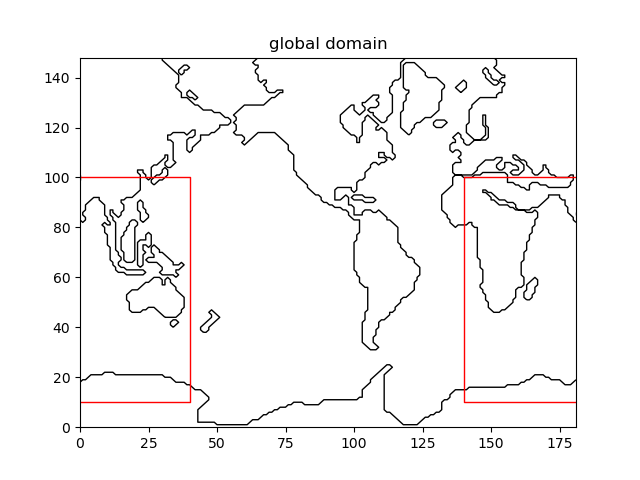
Fig. 2.5 Extracting the Indian Ocean from a global grid
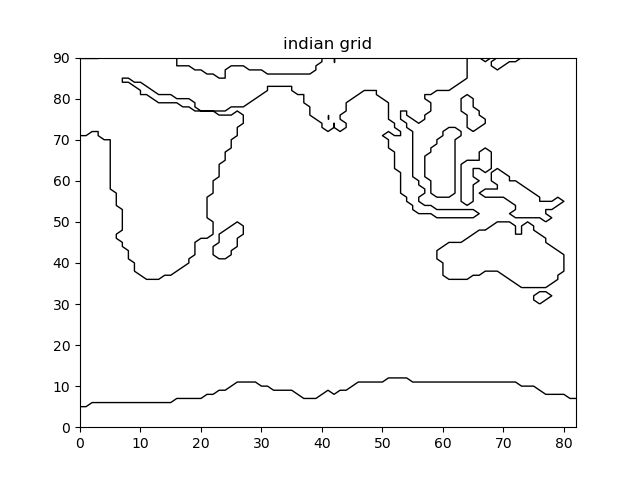
Fig. 2.6 Indian domain that has been extracted
Note that the user may also use the executable program pypago.bin.make_grid as follows:
make_grid.py NEMO data/mesh_mask.nc grid.pygo
This script is an interactive script which allows to chose the values of the
imin, imax,
jmax and jmin variables. The arguments are the model name,
the model mesh file and the name of the output file.
2.3.1.3. Extracting gridded sections
The extraction of gridded section is achieved by using the pypago.sections.extract_grid_sections() function.
The function takes as arguments the pypago.grid.Grid object and the list of section endpoints (pypago.sections.Section objects).
It returns a list of pypago.sections.GridSection objects (gridsec in the example below) and the indexes of the discarded sections (badsec in the example below).
import pypago.sections
import pypago.pyio
import pylab as plt

grid = pypago.pyio.load('data/indian_grid.pygo')

sect = pypago.pyio.load('data/endpoints_indian.pygo')

gridsec, badsec = pypago.sections.extract_grid_sections(grid, sect)

pypago.pyio.save(gridsec, 'data/indian_gridsec.pygo')

plt.figure()
grid.plot_mask()
for s in gridsec:
    s.plotsecfaces()
plt.savefig('figs/indian_gridsec.png')
In [13]: import os

In [14]: cwd = os.getcwd()

In [15]: print(cwd)
/home/barrier/Codes/pago/pypago/doc_pypago

In [16]: fpath = "examples/define_gridsec_indian.py"

In [17]: with open(fpath) as f:
   ....:     code = compile(f.read(), fpath, 'exec')
   ....:     exec(code)
   ....:
In [18]: print(badsec)
[]

In [19]: for sec in gridsec:
   ....:     print(sec)
   ....:
Gridded section, NEMO model:
  -areavect: (31, 70)
  -depthvect: (31, 70)
  -dire: (1,)
  -faces: (70,)
  -i: (2,)
  -imax: 40
  -imin: 140
  -j: (2,)
  -jmax: 100
  -jmin: 10
  -lengthvect: (70,)
  -lvect: (70,)
  -modelname: NEMO
  -name: section4
  -nlon: 182
  -orient: (70,)
  -veci: (70,)
  -vecj: (70,)

Gridded section, NEMO model:
  -areavect: (31, 51)
  -depthvect: (31, 51)
  -dire: (1,)
  -faces: (51,)
  -i: (2,)
  -imax: 40
  -imin: 140
  -j: (2,)
  -jmax: 100
  -jmin: 10
  -lengthvect: (51,)
  -lvect: (29,)
  -modelname: NEMO
  -name: section5
  -nlon: 182
  -orient: (51,)
  -veci: (51,)
  -vecj: (51,)
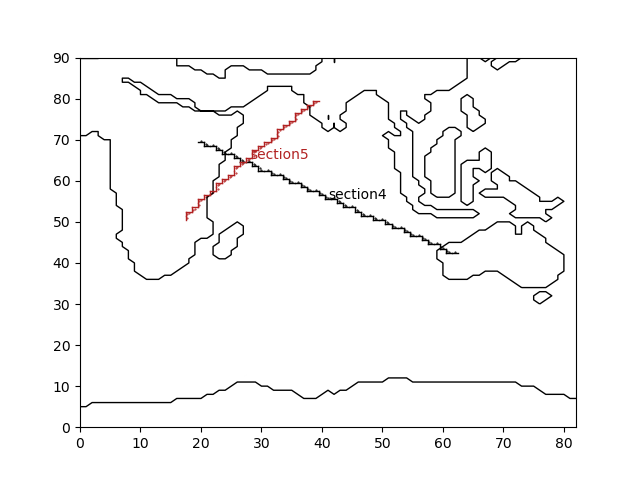
Fig. 2.7 Indian Ocean gridded sections
The user is strongly invited to use the executable program pypago.bin.make_gridsec, which is run as follows:
make_gridsec.py grid.pygo endpoints.pygo gridsec.pygo
This interactive program allows the user to check that the sections are well defined (see Warning below), and gives the possibility to correct badly defined sections. It takes as argument the name of the name of the PAGO grid and endpoints file, and the name of the output file.
Warning
It is essential to verify that the orientations of the segments are consistent, i.e. that the dots are on the same side of the line, as in Fig. 2.13. If this is not the case, the section orientation must be corrected.
Furthermore, to perform budgets within a basin, it is essential to ensure that the basin is closed (i.e. that there is no leakage). If not, it might be necessary to add another section or to displace points from sea to land.
2.3.2. Using graphical user interface
The extraction of gridded sections may also be achieved through the use of the
pypago.guis.gui_grid_model Python program. This opens the GUI
that is shown in Fig. 2.8.
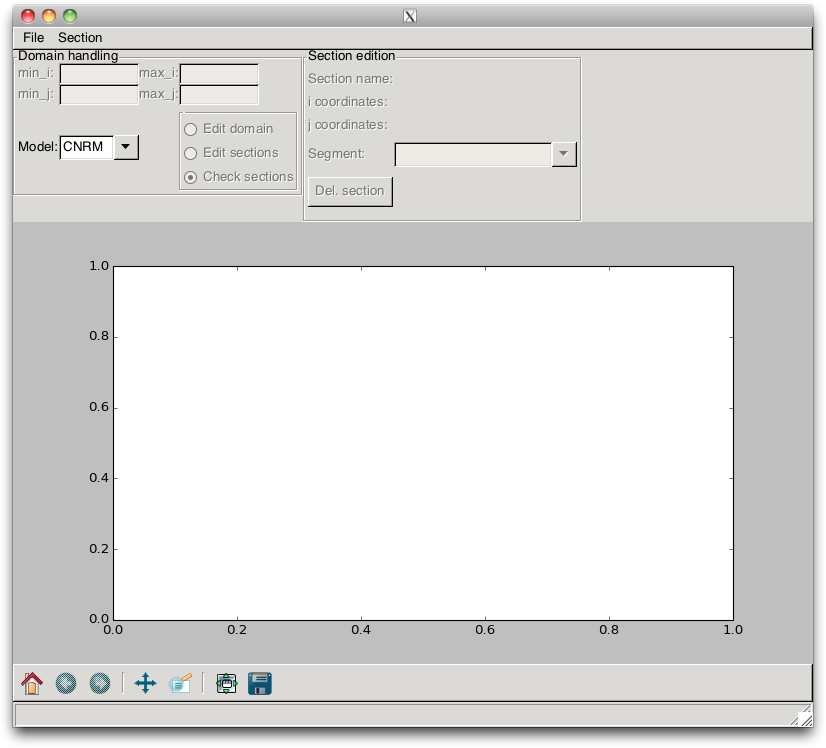
Fig. 2.8 GUI of the pypago.pypago_guis.gui_grid_model program
2.3.2.2. Opening a meshfile
As a first step, the user must define the name of the model that is going to be processed. This is done by setting the Model ComboBox. Then, the user must load the NetCDF meshfile of the model by using the menu item. When this is done, the mask of the model is plotted, as shown in Fig. 2.9, and the default domain is plotted as a black rectangle. The next step is to edit the domain, for instance by reducing the size of the domain according to the section positions.
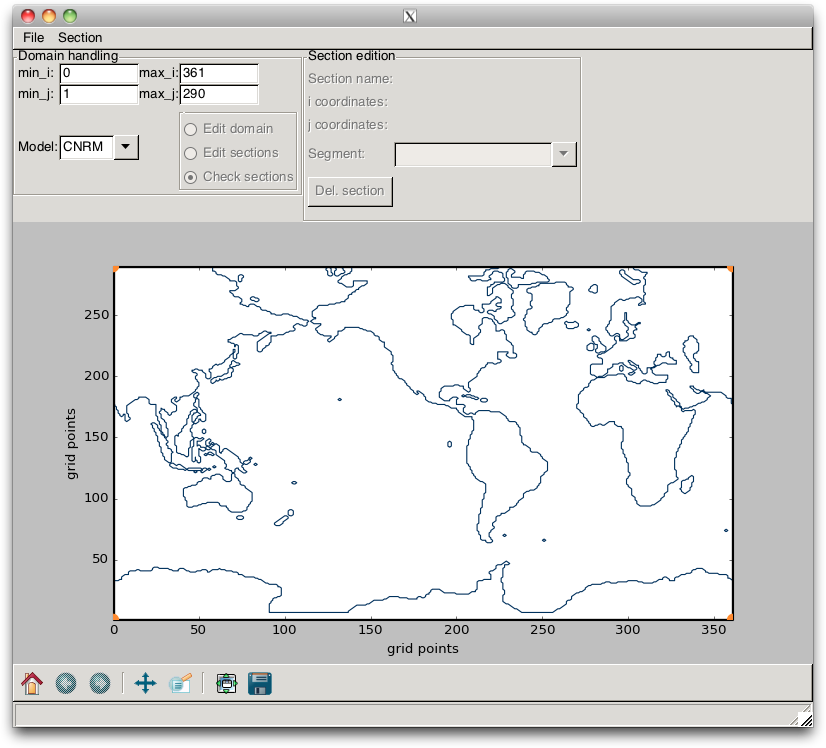
Fig. 2.9 Example of the mask of a global model configuration (here, the CNRM model).
2.3.2.3. Domain edition
The domain edition is handled by the top-left widgets. The min_i, max_i, min_j and max_j widgets control the domain left, right i-indices and bottom, top j-indices, respectively. Default values are set to the biggest possible domain.
The section can be changed by “click and drag” on the corner points (but not on the lines) or by a change in the TextControl widgets. In the latter case, the changes are validated when the ENTER key is pressed. Such a change is shown in Fig. 2.10.
With this specific grid, the user interested in the Indian Ocean might be a little disappointed, since the box domain does not cross it. In order to overcome this issue, the user must set, in the TextControl widgets, a value for min_i that is greater than the value of min_j. This switches the previous box into two boxes, as shown in Fig. 2.11. With this layout, the user can define a domain that encompasses the Indian Ocean.
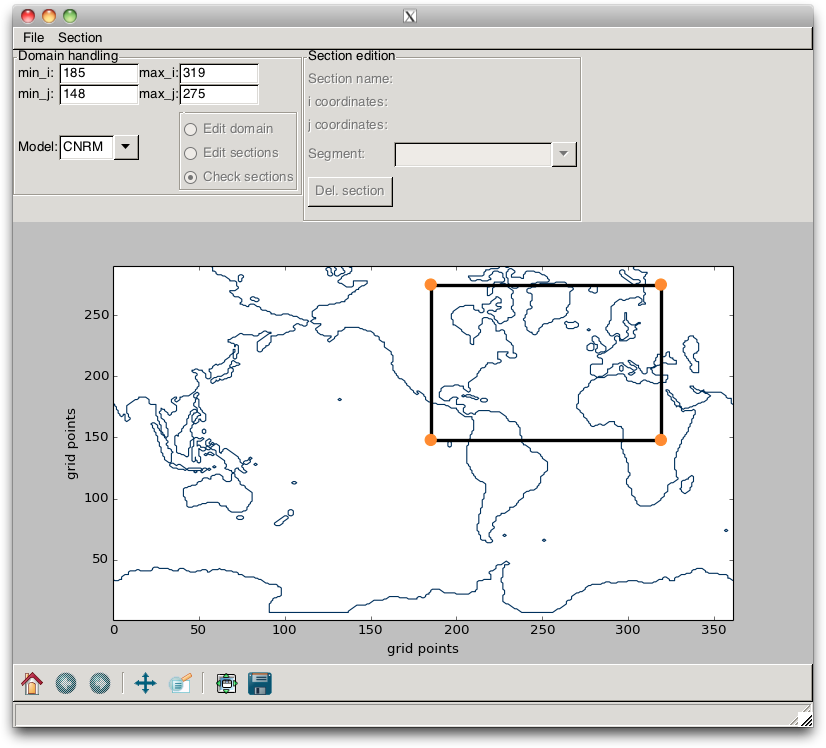
Fig. 2.10 Example of a change in domain
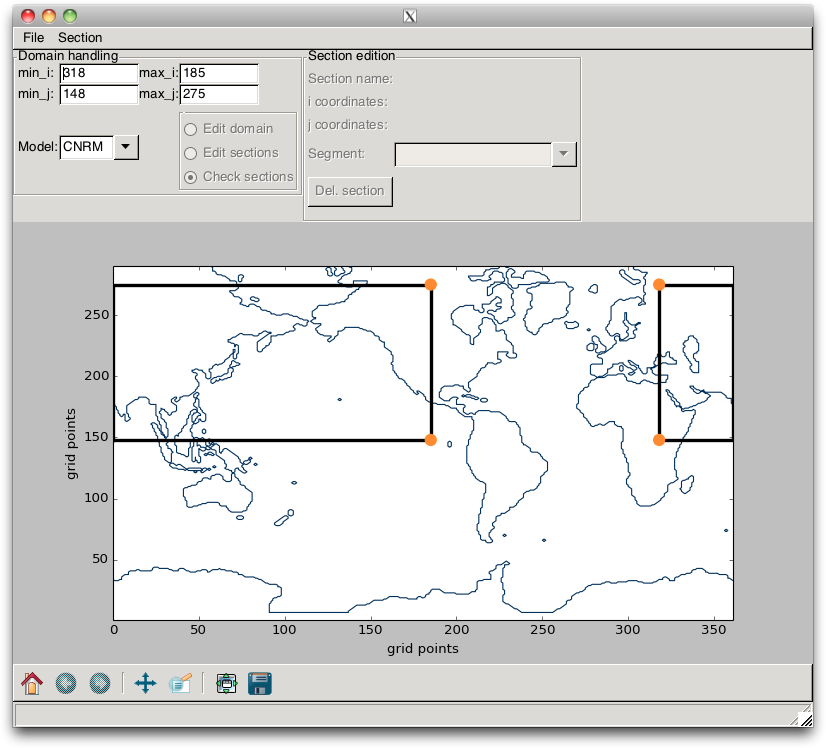
Fig. 2.11 Example of a change in domain, when the min_i value is greater than the min_j value.
2.3.2.4. Loading a section file
When the meshfile is loaded and the subdomain selected, the user must
now the section endpoints that have been generated using the
pypago.pypago_guis.gui_sections_edition.
When this is done, the program
computes the model indices that are associated with the section
endpoints (these indices are model dependent) and draw the sections as
“stairs”, as shown in Fig. 2.12.
When this is done, the top-left RadioBox activates and switches to
Check sections.
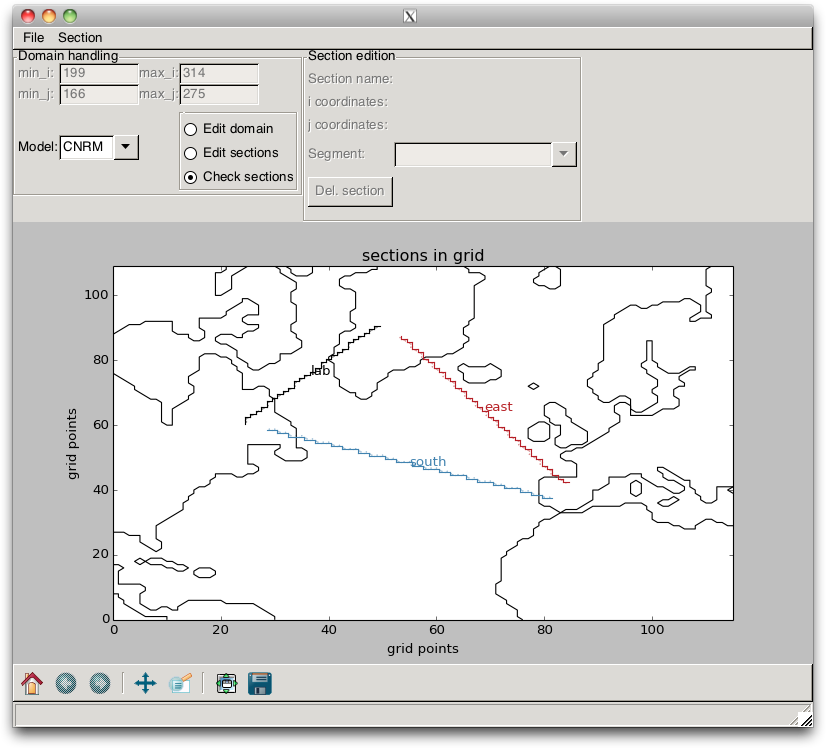
Fig. 2.12 Section “stairs” that are drawn when loading a section file
into the pypago.pypago_guis.gui_grid_model program.
2.3.2.5. Checking and editing the sections
When these “stairs” are plotted, the user must verify that they are well defined. The points that appear on the figure and which define the direction where the transport is counted positive must all be on the same side of the line, as in Fig. 2.13. If it is the case, the user can save the model indices that are associated with the sections into a file, by using the / menu items.
If they are not, the user must change the direction of the bad segments. This is done by switching the RadioBox to Edit Sections. This edition mode is similar to the one described previously, except that the section edition can only be achieved by modifying the point positions. Furthermore, if the user plans to perform budgets within closed domains, he needs to check that the sections indeed define a closed domain.
If the domain is too large compared to the section positions, the user may also be interested in reducing the size of the domain. This is done by switching the RadioBox to Edit Sections. Note that the / menu item is only activated when this RadioBox is set to Check Sections, in order to force the user to check that the sections are well defined.
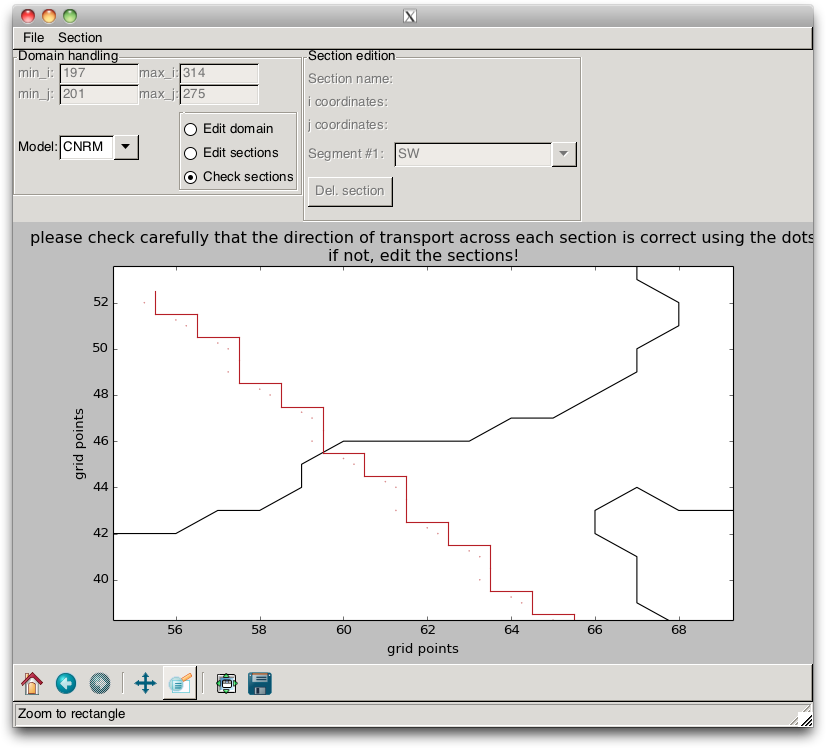
Fig. 2.13 Gridded section
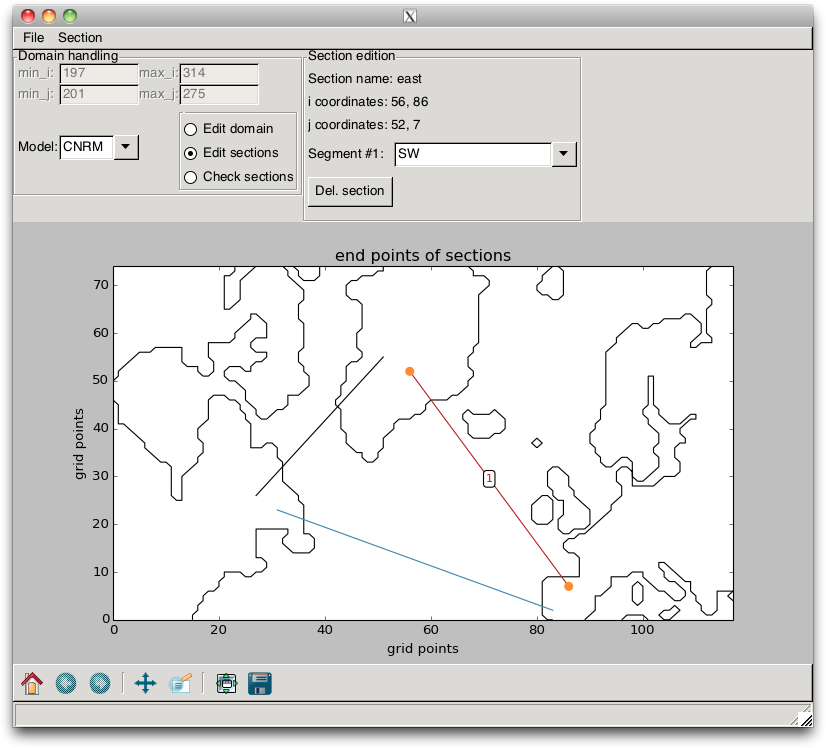
Fig. 2.14 Section correction
When the user is done, he can save the outputs of the program into
.pygo files. If the chosen saving path is /output/path/file.pygo,
the Grid object will be saved in the /output/path/file_grid.pygo file,
while the GridSec objects will be saved in the /output/path/file_gridsec.pygo file.